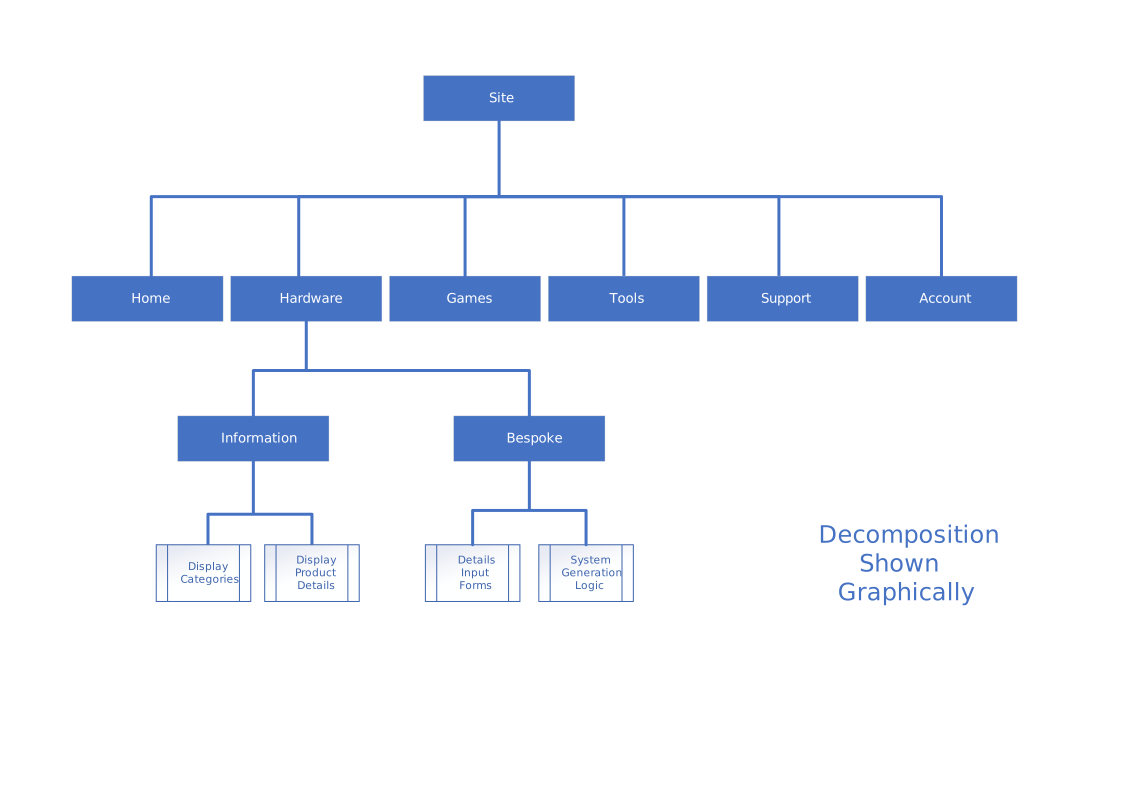
Final step: Displaying the decomposition graphically


In the 'Our Approach section', we outlined our decomposed elements. In many cases, it would be convenient and useful to show this as a nested list with Parent, Child, and Grandchild shown by indenting the list.
Item
__Sub Item 1
__ Sub Item 2
____ Sub sub item 1
More often, we create a graphical diagram because of all the advantages they have, as we have already discussed.
This would be shown as a tree diagram, much like the Navigation diagram shown earlier.
However, this style of demonstration can become difficult to show in a diagram of an appropriate size. If the number of options is large, it becomes difficult to fit in.
You might split sections of the decomposition into segments shown in different diagrams. This could be very useful, but it will probably take more time.
I have a section of a decomposition diagram here. It shows a single component of the abstraction the we showed in the Decomposition Approach page.
Note that on this graphic, I have included some symbols from the flowchart standard to show that the block will be code that is written by the developer. In Visio, the symbol is named 'Subprocess'.